The Power BI KPI Trend Axis
I love the idea of KPI visuals. The concept that a quick glance will instantly tell you whether something is good, bad, or meh is incredibly appealing.
But Power BI comes up way short here. Sure, you can import your existing PowerPivot model with measures and KPIs from Excel, but that process won’t be much help when starting from an existing Power BI model.
Power BI does have a KPI visual, but it’s a little tricky to get right and it takes up a ton of space. More importantly, the trend graph in that visual is wildly misleading and can send the wrong impression because there’s no ability to configure the Y-Axis.
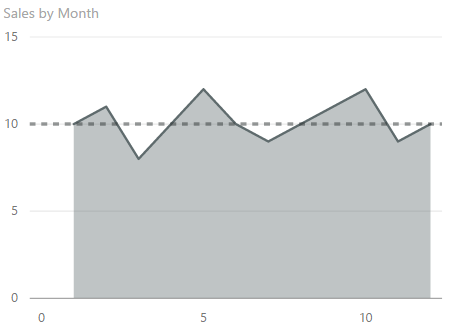
Here’s a fictional example of sales by month, plotted as an area chart with the Y-Axis starting at 0. Sales seem to jump around between 8 and 12 over the course of the year, but you can tell they don’t deviate too far from the median line also plotted.
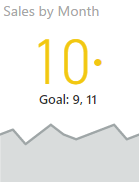
Compare that same data to the KPI visual with the Trend Axis enabled. The graph incorrectly suggests we have dramatic increases and decreases each month. This is because the Y-Axis starts at the minimum data value (8) and goes to the maximum data value (12). Unlike the other visuals, you cannot muck with the start and stop points.
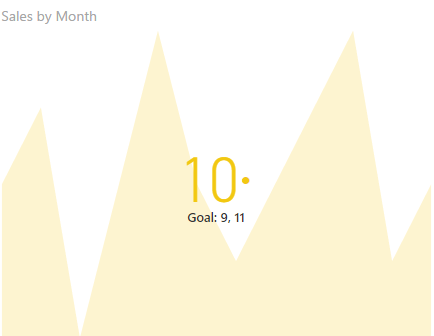
Hopefully Microsoft issues an update to this visual which allows configuration of the Y-Axis values. For now you’re probably best served by removing the KPI trend axis and stacking an area, line, or column chart below the KPI with a fixed Y-Axis.
Something like this works pretty well for reports, but breaks down for dashboards because you can’t overlap the tiles.